What is Undo’s core technology? → It records the full execution history of a running program into a single deterministic file.
Why does runtime visibility matter for AI debugging? → AI agents can only reason about code they see; without execution traces they miss the actual behavior that caused a failure.
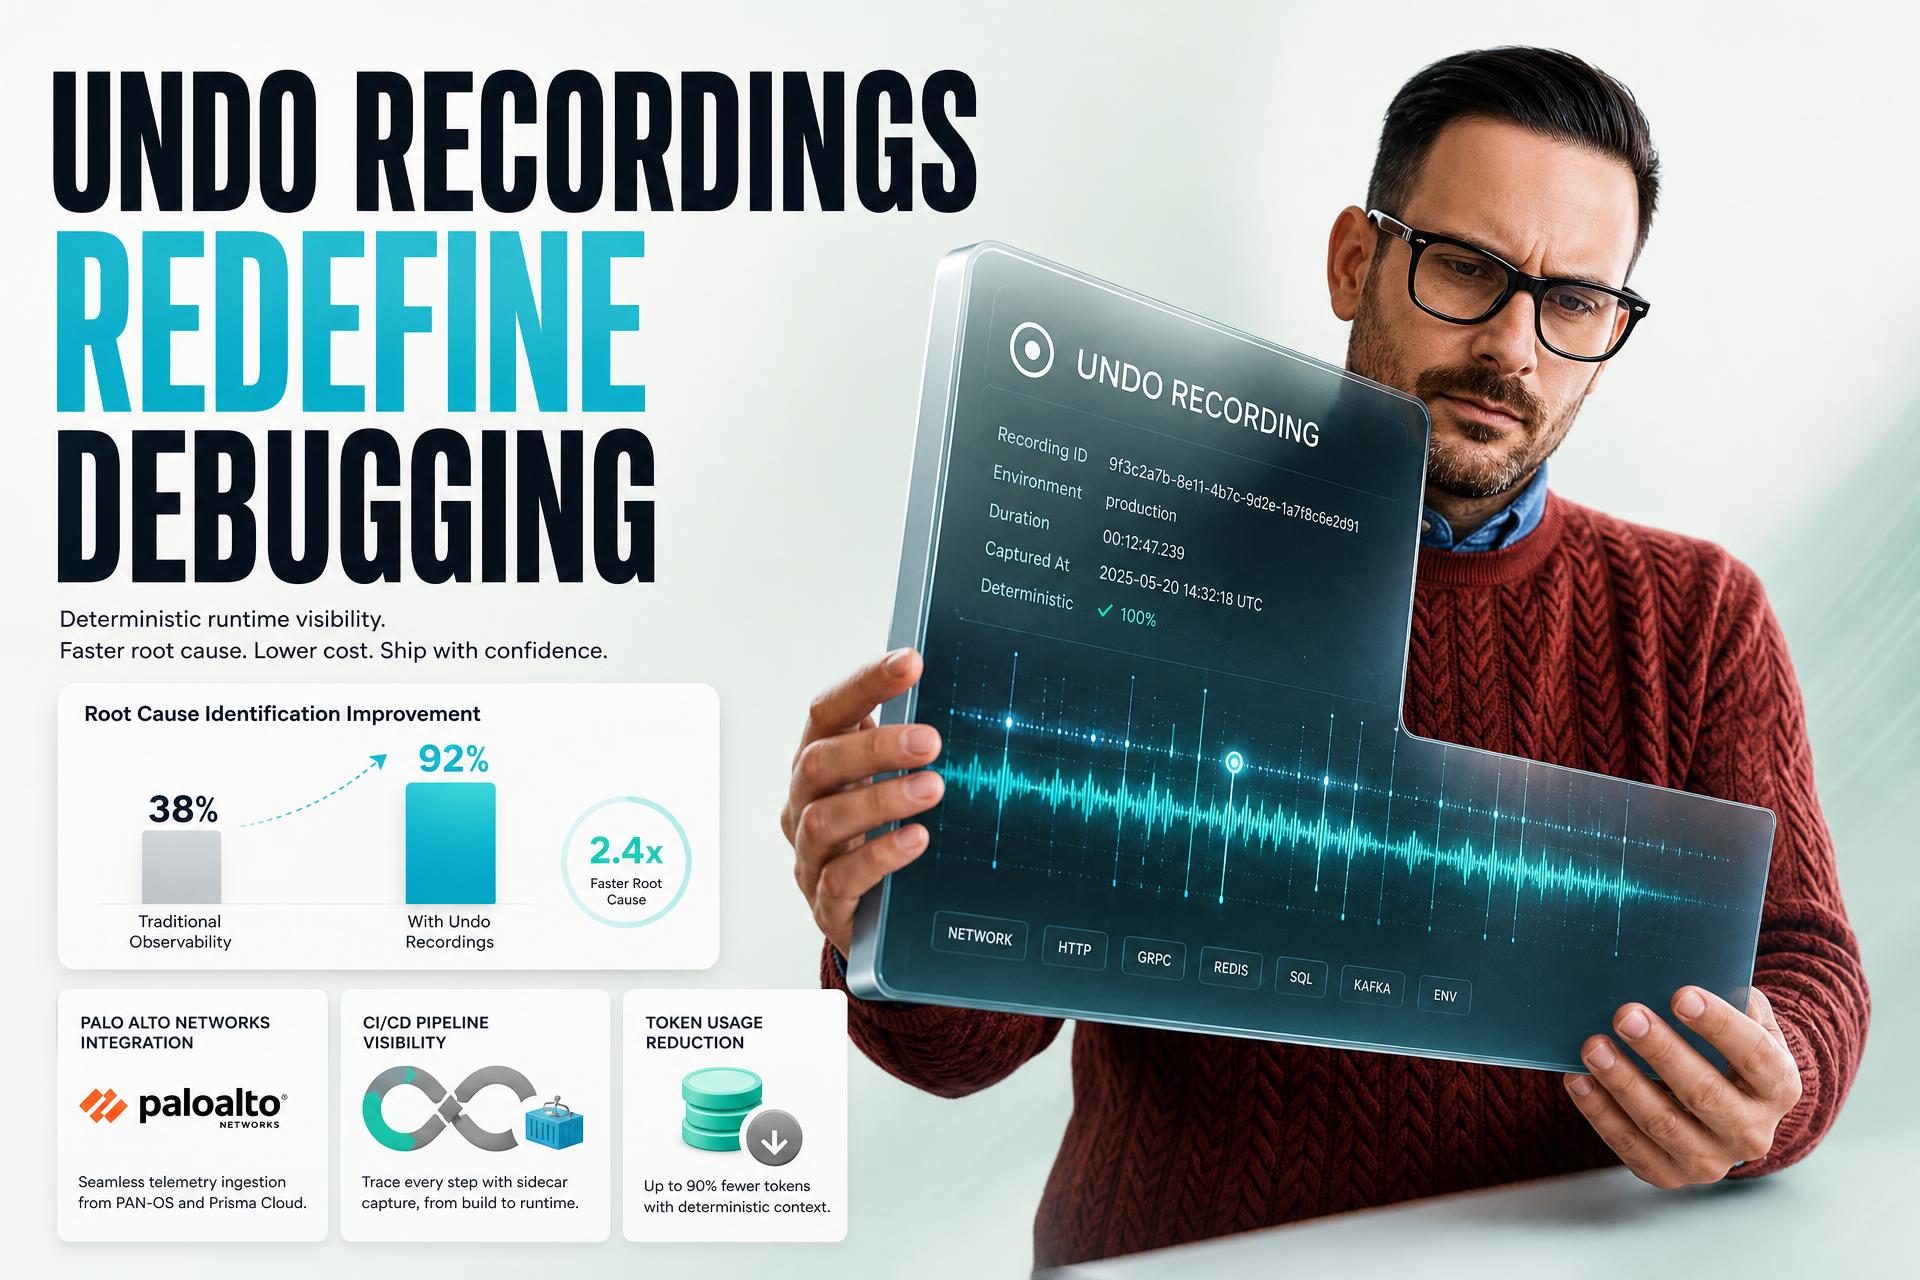
How much does accuracy improve with recordings? → Benchmarks show root‑cause identification jumps from 38% to 92% when recordings are supplied.
Which customers already benefit? → Palo Alto Networks reports minutes‑scale autonomous bug pinpointing in large codebases.
What decision does this force engineering leaders to make now? → Whether to embed deterministic program recording into their AI‑assisted debugging pipelines this quarter.
Quick Answer: How to Make AI‑Assisted Debugging Reliable with Runtime Recordings
AI‑assisted debugging only becomes dependable when the underlying model is fed a deterministic execution trace that captures every state change, I/O event, and branch taken by the program. By attaching Undo’s program‑recording file to the prompt, the model can reason on concrete runtime evidence rather than speculative source‑code patterns, raising root‑cause discovery from roughly one‑third to over nine‑tenths of cases. The practical step is to integrate the recording collector into your CI/CD pipeline, store the artifact in a versioned blob store, and surface it to any LLM‑based analysis tool you employ.
Key rule: Runtime visibility, not model size, is the decisive factor for AI‑driven bug detection.
Why Code‑Only Views Fail Modern AI Debuggers
Most AI coding assistants ingest only the static source files that developers push to a repository. This approach ignores the dynamic context—memory layouts, thread interleavings, and external service responses—that actually trigger failures in production. When a bug manifests only under a specific runtime condition, the model’s inference is forced to guess, leading to low precision and wasted developer time. Undo’s recordings preserve the exact sequence of operations, turning an opaque failure into a reproducible trace that any downstream LLM can consume with certainty.
- Missing State: The model cannot infer variable values that exist only at runtime.
- Non‑Deterministic Paths: Thread races and async callbacks appear as invisible branches.
- External Dependencies: Network calls and database queries are abstracted away, hiding latency‑related bugs.
- Environment Drift: Configuration differences between dev and prod are invisible to static analysis.
- Token Overload: Supplying full source files forces the model to truncate, discarding crucial context.
Undo’s Program Recording: What It Actually Captures
Undo’s technology instruments the binary at load time, intercepting every instruction, system call, and memory allocation. The resulting file is a compact, deterministic log that can be replayed to reconstruct the exact state of the process at any moment. Unlike traditional logs, which are sparse and hand‑crafted, the recording is exhaustive and requires no developer instrumentation. This means the same artifact can be fed to an LLM, a static analyzer, or a visual debugger without further modification, providing a universal runtime snapshot.
Instrumentation Hook: Insert a lightweight shim that hooks into the program’s entry point.
Event Capture: Log each opcode, syscall, and memory mutation to a binary stream.
Compression Layer: Apply lossless compression to keep the file size manageable for large workloads.
Storage API: Push the compressed artifact to an object store (e.g., S3) with immutable versioning.
Retrieval Interface: Expose a REST endpoint that returns the recording for downstream AI services.
Benchmark Evidence: From 38% to 92% Root‑Cause Success
Undo’s internal experiments measured a suite of complex bugs across networking, database, and semiconductor codebases. When a state‑of‑the‑art LLM was asked to diagnose failures using only source files, it identified the true cause in 38 % of cases. Supplying the same model with Undo’s execution recording lifted that figure to 92 %, a more than two‑fold improvement. Additionally, token consumption dropped dramatically for problems the model could already solve, and customers reported up to a hundred‑fold speedups in root‑cause analysis.
| Scenario | Root‑Cause Identification | Token Usage |
|---|---|---|
| LLM only (source) | 38 % | High |
| LLM + Undo recording | 92 % | Low |
| Human analyst (baseline) | 70 % | N/A |
Embedding Recordings into Your AI Toolchain
To reap the benefits, teams should treat the recording as a first‑class artifact in the same way they treat compiled binaries. During CI, after unit tests pass, the recorder runs a full integration test suite, captures the trace, and publishes it alongside the build artifact. When a developer opens a pull request, the AI assistant fetches the latest recording, attaches it to the prompt, and returns a pinpointed diagnosis. This workflow can be built on top of existing cloud‑software development platforms, leveraging APIs such as the cloud software development suite.
Architectural Integration Points
The recording collector sits between the application runtime and the AI inference service. It can be deployed as a sidecar container in Kubernetes, as a Lambda wrapper for serverless functions, or as a native library for on‑premise binaries. The AI service consumes the recording via a secure HTTP endpoint, decodes it into a structured JSON representation, and feeds it to the LLM along with the source code. This decouples the heavy‑weight tracing logic from the model, allowing teams to upgrade either component independently.
What This Means for Engineering Teams This Quarter
The immediate implication is that organizations cannot rely on AI assistants that only see source code. If you plan to roll out an AI‑driven debugging assistant in the next three months, you must first provision a deterministic recording pipeline. That involves allocating compute for the recorder, extending your CI/CD definition to capture and store the artifacts, and updating the prompt schema of your LLM integration. Skipping this step will lock you into low‑accuracy, high‑friction debugging cycles that waste developer time and increase operational risk.
The upside is concrete: teams that adopt recordings can expect faster incident resolution, lower on‑call fatigue, and a measurable boost in the success rate of AI‑generated fixes. Moreover, the data generated by recordings can be reused for downstream analytics, such as performance profiling or security auditing, amplifying the return on investment.
Decision Framework for Selecting Debugging Solutions
When evaluating tools, prioritize those that expose a deterministic execution trace rather than those that merely claim AI‑powered insights. Compare vendors on three axes: (1) fidelity of the runtime capture, (2) ease of integration with existing CI pipelines, and (3) cost model relative to the volume of recordings generated. Solutions that require custom instrumentation or that produce incomplete traces will erode the benefits demonstrated by Undo’s benchmarks.
Principle: An AI assistant is only as trustworthy as the fidelity of the data it consumes.
Plavno’s Approach to Runtime‑Aware AI Agents
At Plavno we combine Undo’s deterministic recordings with our own AI agents development platform to deliver end‑to‑end debugging assistants. Our service layer automatically fetches the latest recording, enriches it with metadata from the build system, and constructs a prompt that includes both source and runtime context. By doing so, we enable our clients to ask “Why did this transaction fail?” and receive a concise, actionable answer backed by concrete execution evidence. This approach aligns with our broader AI consulting practice, ensuring that AI models are always grounded in observable system behavior.
- Trace Fidelity: Does the solution capture every instruction and system call?
- Integration Simplicity: Can the recorder be added as a sidecar without code changes?
- Scalability: Is storage cost‑effective for large, frequent builds?
- Security: Does the artifact contain sensitive data and how is it encrypted?
- Vendor Support: Is there a clear roadmap for AI model updates?
Audit Current Toolchain: Identify gaps where runtime data is missing.
Plan Recorder Deployment: Choose sidecar, library, or serverless wrapper.
Define Storage Strategy: Select encrypted bucket and retention policy.
Update AI Prompts: Include recording reference in every LLM request.
Monitor Outcomes: Continuously assess accuracy and cost, adjusting as needed.
Cost and Performance Trade‑offs
Recording every instruction adds CPU overhead, typically in the low‑single‑digit percentage range, and increases storage consumption. However, the reduction in token usage for LLM queries offsets these costs by lowering the number of API calls needed for each debugging session. For high‑frequency CI pipelines, the incremental compute can be amortized across many runs, especially when recordings are compressed and retained for a limited retention window. Teams should model the total cost of ownership by factoring both the recorder runtime and the downstream AI service fees.
| Factor | Impact Without Recording | Impact With Recording |
|---|---|---|
| CPU Overhead | 0 % | +3 % per test run |
| Storage Cost | N/A | 0.5 GB per build (compressed) |
| LLM Token Spend | High | Low |
| Debugging Time | Hours | Minutes |
Future Outlook: AI‑Driven Debugging as a Service
As LLMs become more capable, the market will gravitate toward subscription‑based debugging platforms that ship with built‑in runtime recordings. Vendors that separate the recording engine from the AI model will enjoy a competitive edge, because they can swap out the underlying LLM without re‑instrumenting applications. This modularity also enables enterprises to run recordings on‑premise for security while leveraging cloud‑hosted AI for analysis, creating a hybrid model that maximizes both control and scalability.
Takeaway: Prioritize deterministic execution traces before scaling AI‑driven debugging.
Conclusion: Prioritize Runtime Visibility in AI Debugging
Embedding Undo’s deterministic program recordings into your AI‑assisted debugging workflow is no longer optional—it is the decisive factor that separates effective, production‑grade solutions from speculative prototypes. By committing to a runtime‑first architecture this quarter, engineering leaders can dramatically improve root‑cause accuracy, cut token costs, and accelerate incident response. The shift also unlocks secondary benefits such as performance analytics and compliance auditing, turning a single investment into a multi‑purpose observability platform.
The path forward is clear: adopt a recording collector, integrate it with your CI/CD, and feed the resulting artifact to your LLM. The measurable gains demonstrated by Undo’s benchmarks—up to a 92 % success rate—show that the payoff is both technical and financial. Teams that act now will establish a resilient AI debugging foundation that scales with future model improvements.
- Start Small: Pilot on a low‑risk service to validate the workflow.
- Secure Artifacts: Encrypt recordings and enforce strict access controls.
- Measure Impact: Track accuracy, token spend, and resolution time.
- Iterate Integration: Refine CI hooks and prompt schemas based on feedback.
- Scale Systematically: Roll out across teams with governance and cost controls.
Audit Current Toolchain: Identify gaps where runtime data is missing.
Plan Recorder Deployment: Choose sidecar, library, or serverless wrapper.
Define Storage Strategy: Select encrypted bucket and retention policy.
Update AI Prompts: Include recording reference in every LLM request.
Monitor Outcomes: Continuously assess accuracy and cost, adjusting as needed.

